Making Sense of Measuring Heart Rate Variability
Attention to heart rate variability (HRV) in the medical, sports, and personal fitness fields has grown in recent years. Moreover, COVID-19 treatments can affect variability, and this has driven the heart rate variability monitor market, along with the demand for the HRV analysis software that accompanies it. But to capture and analyze HRV isn’t always easy, especially when the patient is in an uncontrolled situation or is moving.
As the ability to accurately measure and process both the signature of a heart beat and the amount of time between heart beats has improved, so has the data we have been able to collect from HRV. As a result, HRV is now seen as a viable, non-invasive way to gauge a variety of issues ranging from morbidity to exercise program optimization. Because of these improvements, heart rate variability equipment ranging from personal fitness devices to professional heart rate variability equipment is increasingly common on the market.
However, measuring heart rate variability and, behind that creating and implementing an HRV analysis model, is still a young science, and tricky. HRV analysis software needs to take into account interrupted data sequences, poor data quality including noise.
To get a feel for the intricacies of the matter, this article looks at what HRV is, along with the issues that make hrv analysis software specialized, and where the HRV device market is going.
Heart rate variability
People often call their heart their ‘ticker’, but it’s a bit of a misnomer. The beating of the human heart is much more irregular than is commonly thought, even at rest. The amount of variability between beats, called the heart rate, and under what conditions, such as sitting, standing or moving, tells a lot about the health of a person. More variability is sometimes but not always better.
HRV is complex; in their paper ‘An Overview of Heart Rate Variability Metrics and Norms’, for the U.S. government’s National Institute of Health, the authors claim that HRV “can bgente described by mathematical chaos”. Figuring out how to calculate heart rate variability can literally be taking aim at a moving target, and the sensor and target are sometimes moving in opposite directions! Moreover, there are several components to heart rate that can be measured and calculated, and each one can tell something different about the person being measured.
Components of HRV
It is possible to make sense of the mathematical chaos that is HRV by looking at sets of variables. One of these variables is the frequency, or number of beats for a given time span. This is usually measured in cycles per second, or Hertz (Hz). .
There are four frequency bands, corresponding to four levels of heart rate activity, that are observed:
- ULF (< 0.003 Hz)
- VLF (0.033-0.04 Hz)
- LF (0.04-0.15 Hz)
- HF (0.15-0.4 Hz)
Focusing on particular bands gives insight into aspects of health that can seem far from the cardiovascular system itself. For example, changes in respiratory rate do not correlate with high frequency heart rate variability in healthy people, but such respiratory rate changes do affect HF HRV in people with psychiatric problems, according to a paper published in the journal Nature.
The heart rate variability monitor needs to capture the power of the heart rate as well as the frequency. Power can best be understood by visualizing the area under the curve on the heart rate variability chart.The area under the whole chart is total power. The area under one frequency equals the power for that band. For LF and HF, the absolute and relative power as well as peak frequency need to be captured.
But the frequency and power are not the only issues at hand. Time between events is also measured as well as the variability and extent of the variation. Measuring the interval isn’t as straightforward as detecting a signal. As a result, capturing enough data for a complete heart rate variability graph often takes time.
There are several factors that hinder the measurement of a clean HR signal, or which could render a false signal.
These can include:
- Biomechanical movement
- External impacts
- Involuntary spasms
The signals these events cause are similar to the heart beat under observation, and distinguishing between them calls for robust and accurate processing. At the same time, commercial grade wearables do not have the same fit as professional heart rate variability equipment, so signal acquisition is more difficult in the first place. The likelihood of gaining a suitable HR set diminishes. Also, algorithms such as Fast Fourier Transformations and Lomb Scargle periodogram work well, but only when the patient is still.
There is another factor involved in gathering enough data for HRV analysis software to even work well. Different cycles and ratios need different lengths of time to collect enough data, and studying the variation in intervals by definition requires a set of intervals to measure in the first place. This may require the wearer to stay still or to wear the device for periods which can last for days or weeks. Also, with battery-operated wearables, power consumption is at a premium, which places burdens on software designers and sensor engineers. The algorithms needed must run as efficiently as possible.
HRV analysis and software
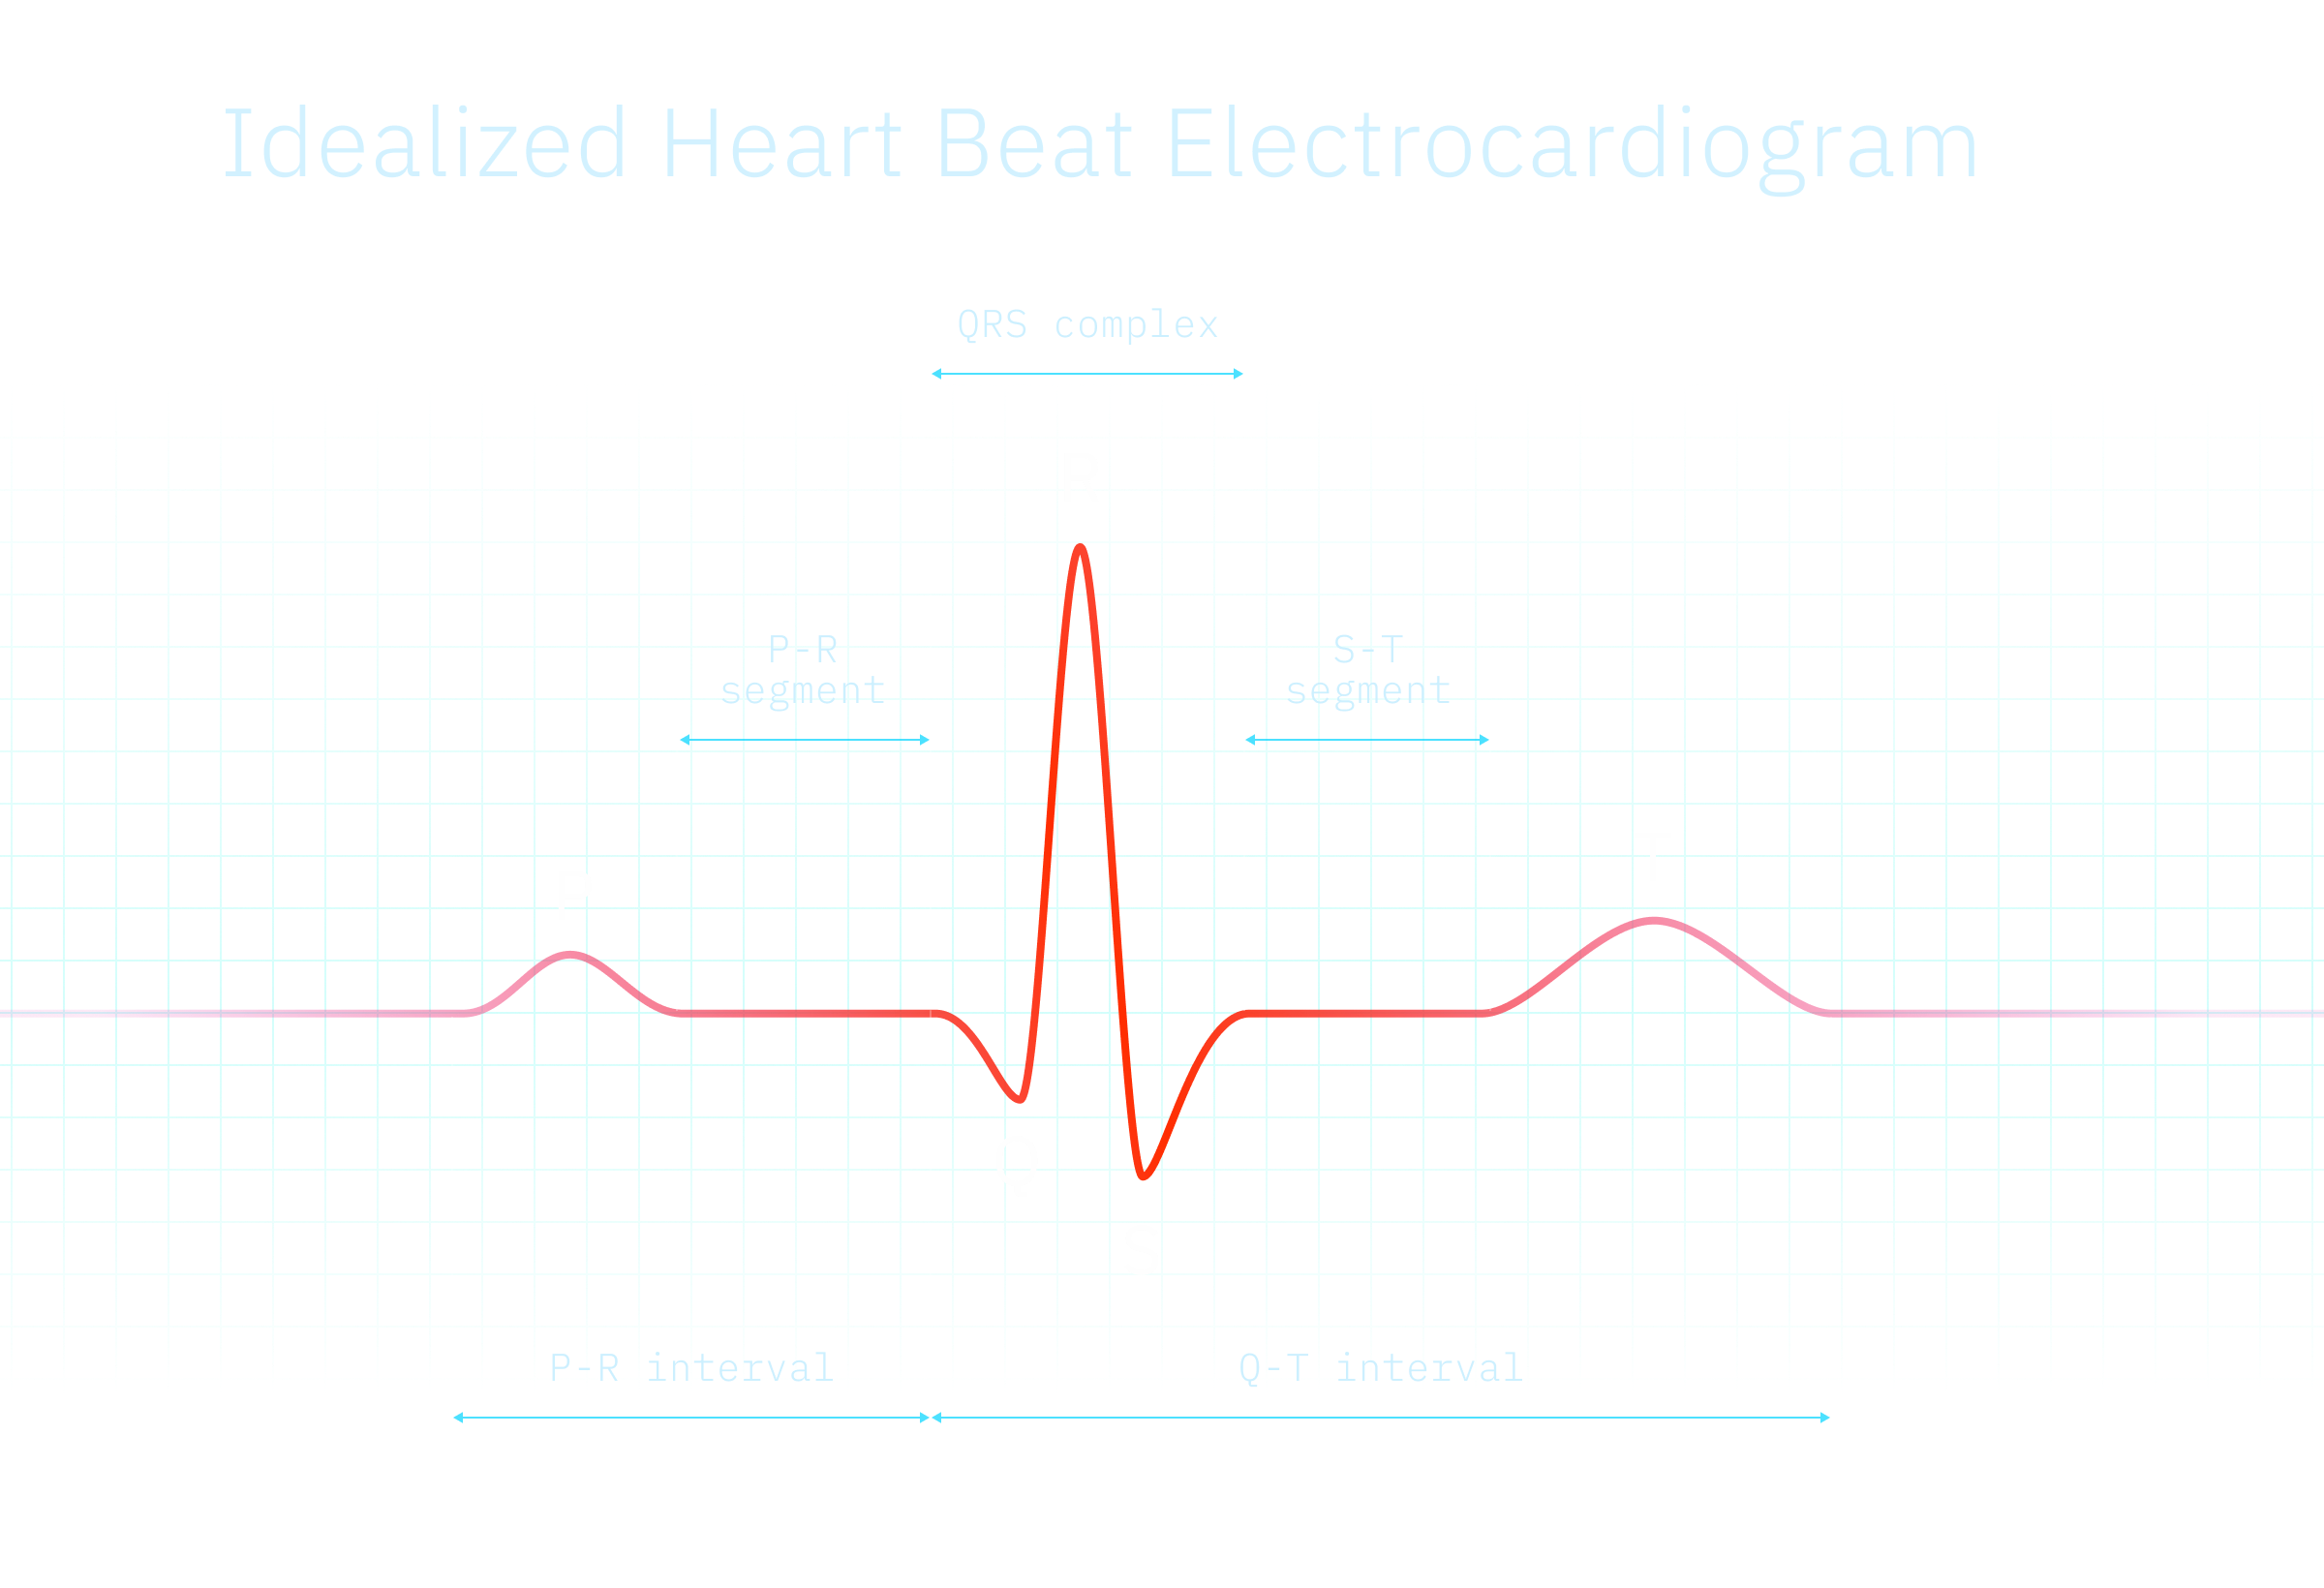
The following graphic shows an idealized heart beat. For HRV equipment, the interval between peak R and the next R is the primary measurement to be taken. Because of the noise introduced to the system by factors such as those listed above, the data might be cleaned up, which can introduce errors. The peak in a processed data set is often termed N to reflect this difference.
Overcoming the noise mentioned above is just one challenge for those creating a heart rate variability monitor. Poor overall power in the case of sick or weak wearers means that sensor sensitivity and / or algorithm processing power is at a premium. Machine learning and Artificial Intelligence can play a huge role in optimizing efficiency.
Software development services related to HRV can seem more like an art than IT at times. When it comes to HRV, knowing what works - and where to explore - due to experience with IoT in wearables as well as what healthcare providers need greatly affects our decisions as solution architects and engineers. And given the increased demand for devices that the COVID pandemic has brought, that goes for both Commercial Off The Shelf as well as professional grade devices.
Modern clinic technology
The overall global market for wearable medical devices is expected to grow from USD 18.8 billion in 2020, to USD 46.6 billion by 2025. Monitors and trackers are expected to make up the bulk of the market. Consumer spending patterns underscored the effect that the COVID pandemic has had on health care, including self care and telehealth. This will in turn drive the need for more sophisticated heart rate variability software solutions.
“Wearables will play a critical role in shaping the digital care experience for consumers. The wearable market is up 30%. What this data indicates is that even when millions of consumers are reevaluating their spending habits, they continue to prioritize wearable technology products over others because there is a potential to help them adapt to this new normal.”
— TaeJong Jay Yang, Senior VP at Samsung Electronics, told CNBC in November 2020.
In an article in Nature in March 2021, the authors also pointed to the acceleration in the use of wearables, and that even current-generation smart watches in conjunction with heart rate variability apps can provide some functionality as a heart rate variability monitor replacement. However, for the accuracy needed to provide insight into more complicated cases, a simple smart watch simply will not do, and in the time of COVID, machines for reading heart rate variability,and recognizing an abnormal delta heart rate in the manner of ECGs in hospitals, can command a premium.
The U.S. Government has recognized both the problem of hospitalization in the time of COVID as well as the solution of remote devices and telehealth. In April 2020, the U.S. Food and Drug Administration began issuing Emergency Use Authorizations (EUAs) for remote patient monitoring. With heart arrhythmia a known potential side effect of COVID treatment, a remote heart rate variability monitor can provide vital monitoring while reducing exposure to the SARS-CoV-2 virus.
With the twin trends of out-patient monitoring as a more common requirement and increasing interest in healthcare gadgets, being able to sense and analyze complicated and intermittent signals such as high frequency heart rate variability will be in greater demand than ever.
Proxet custom solutions
The Machine Learning and Artificial Intelligence techniques we use at Proxet are the basis of technical solutions used by many healthcare and pharmaceutical sector companies. From sensors and data processing to mobile apps to on-demand healthcare analytics software, our broad experience gives us a unique view into how we can help you develop your solution.